Each quarter we share our internal Supply Chain Report where we profile a key indicator that influences the economy and construction in terms of pricing, capacity and consumption. Below are indicators we have shared in the past.
Q2 2023
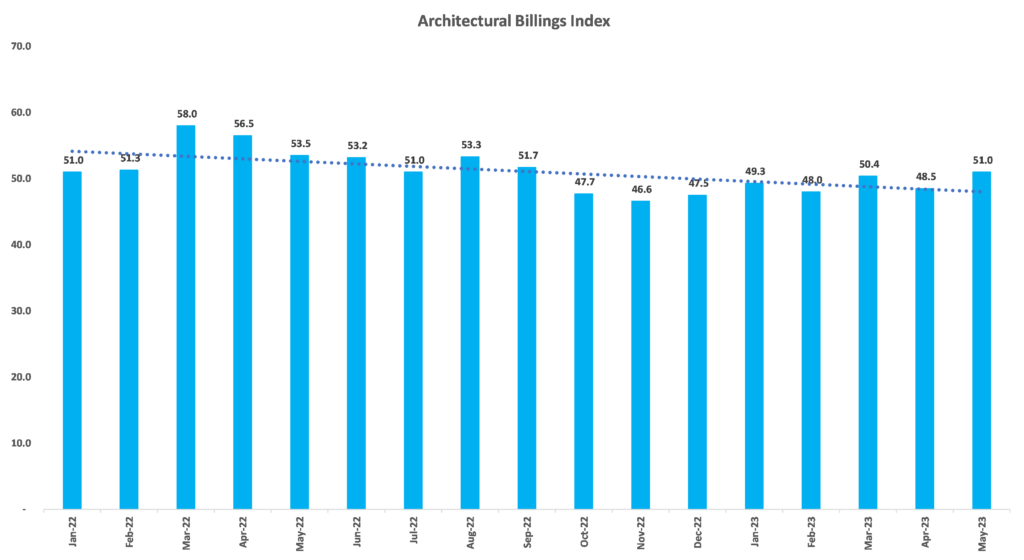
The ABI tracks survey data on billings from leading architectural firms to forecast upcoming non-residential construction. Billings are sorted by region – West, South, Midwest and Northeast – to show most active areas. The ABI report also provides indications of price changes for construction materials in its verbiage section.
How to use it:
+
Architectural projects consume 44% of all steel in the US, which translates to upcoming steel demand as construction jobs generally begin 9-12 months after architectural work is engaged.
We use the ABI to help us evaluate future supply needs. Any reading of 50 or greater on the ABI reflects increases in firm billings and is expected to translate into future construction growth.
Exceptions such as unusual financial events or when a firm may do the architectural work but not build the project as planned, can occur from time to time, however over all the ABI is a trusted indicator of future construction work.
Q2 2022
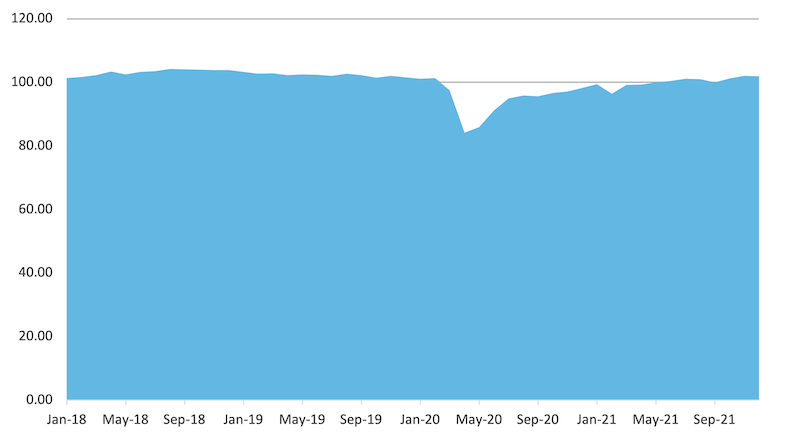
Inflation is the rate of increase in prices over a given period-of-time. The Inflation Rate measures the increase in prices of an index or “basket” of goods and services. While the inflation rate can be used to measure price increases between different periods of time, it most commonly demonstrates year-over-year changes. When inflation rises, the value of a dollar will get you less goods or services compared to the prior year.
Key drivers leading to rising inflation are increased buying / spending along with a tighter supply of goods and services. The pandemic set conditions where both situations occurred. As businesses and the economy began to reopen, demand for goods and services increased. Meanwhile, supply was still constrained by three factors: labor shortages, material shortages due to supply chain issues and higher than normal customer demand.
To combat rising inflation rates, and prevent a recession, the Federal Reserve may increase interest rates. Higher interest rates increase the cost of money and can slow consumer demand. Lower demand will lead to prices coming down leading to lower consumer financing and borrowing which in turn can result in delayed or canceled project investment.
We track the US Inflation Rate to understand how prices are increasing compared to prior periods. Rising costs such as fuel, electricity, natural gas and labor all impact the cost of producing steel. Engineering, logistics and other services become more expensive. Inflation also may indicate the potential for higher interest rates that could lead to delayed or cancelled project investment.

Q4 2021
Changes in the G17 for primary metals shows production shifts that can be directly related to major industry changes, events like greater imports starting in the 1980’s, changes from Integrated to Mini Mill dominance and major market related events like 2008/2009 market crash.
How to use it:
We track the overall index plus some market specific indexes for construction, manufacturing and materials that use steel products. The performance of industries related to steel, such as auto, construction and energy help us determine how tight our steel and scrap supply will be translating into both availability and price information.
It is important to watch this index to see how markets react to these events. This allows us to better predict future events.
Q3 2021
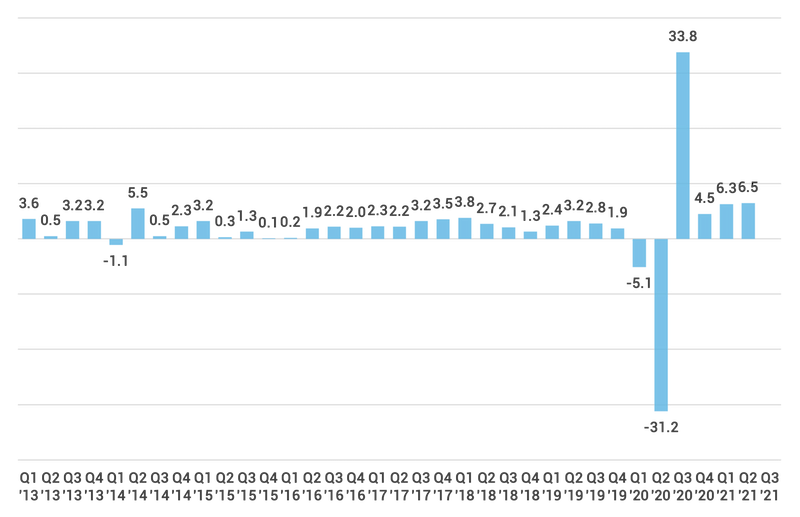
The index is measured quarterly and offers insight to historical trends and current general economic health. The GDP is also published by industry to offer more specific indicators of growth and expansion.
How to use it:
Understanding what impacts the GDP helps us better evaluate economic changes for making business decisions. Seasonal adjustments such as vacation hours, winter slowdowns and holiday closures can affect the GDP and therefore are all accounted for in seasonal adjustments of the index.
Further, unpredictable events, such as the COVID-19 pandemic can impact the GDP as we saw in 2020. We saw the GDP drop by 31.4% in the second quarter and increase by 33.1% in the third quarter resulting in GDP net growth of 1.7%.
Q2 2021
How to use it:
Architectural projects consume 44% of all steel in the US, which translates to upcoming steel demand as construction jobs generally begin 9-12 months after architectural work is engaged. We use the ABI to help us evaluate future supply needs. Any reading of 50 or greater on the ABI reflects increases in firm billings and is expected to translate into future construction growth.
Exceptions such as unusual financial events or when a firm may do the architectural work but not build the project as planned, can occur from time to time, however overall the ABI is a trusted indicator of future construction work.
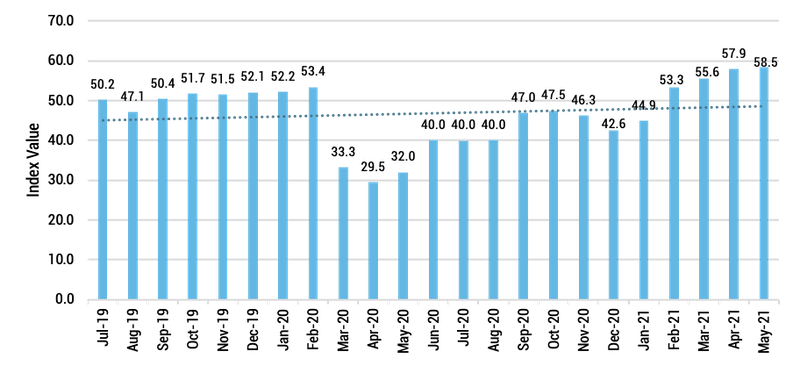
https://www.aia.org/resources/10046-architecture-billings-index-abi
Architecture Billings Index (ABI)
The Architecture Billings Index (ABI) tracks survey data on billings from leading architectural firms to forecast upcoming non-residential construction. Billings are sorted by region – West, South, Midwest and Northeast – to show most active areas. The ABI report also provides indications of price changes for construction materials in its verbiage section.
How to use it:
Architectural projects consume 44% of all steel in the US, which translates to upcoming steel demand as construction jobs generally begin 9-12 months after architectural work is engaged. We use the ABI to help us evaluate future supply needs. Any reading of 50 or greater on the ABI reflects increases in firm billings and is expected to translate into future construction growth.
Exceptions such as unusual financial events or when a firm may do the architectural work but not build the project as planned, can occur from time to time, however overall the ABI is a trusted indicator of future construction work.
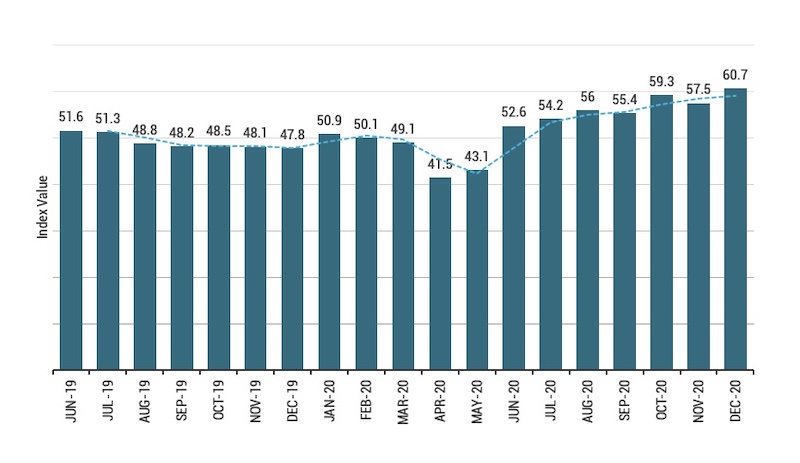
Q1 2021
The PMI measures and tracks trends for the five following categories:
1. New orders from customers
2. Lead time for deliveries – how quickly orders are shipped
3. Inventory levels at participants
4. Production levels and back logs
5. Employment rates within industries
How we use it:
We specifically review markets that we think will impact prices and availability of steel products, such as the manufacturing PMI which best reflects steel demand.
Any PMI index level of greater than 50 equates to expansion in that market, any PMI level of 50 equates to no change in that market and any PMI index level of below 50 equates to contraction in that market.
This information helps us better understand the fluctuations in supply and demand, as well as relevant history to predict how pricing will change based on lead times, supply problems and demand trends.
https://www.ismworld.org/supply-management-news-and-reports/reports/ism-report-on-business/
PMI Index
Issued by the Institute for Supply Management, these reports measure economic change month to month to illustrates trends in the industry. The data comes from monthly surveys submitted by purchasing managers in specific fields.
The PMI measures and tracks trends for the five following categories:
1. New orders from customers
2. Lead time for deliveries – how quickly orders are shipped
3. Inventory levels at participants
4. Production levels and back logs
5. Employment rates within industries
How we use it:
We specifically review markets that we think will impact prices and availability of steel products, such as the manufacturing PMI which best reflects steel demand.
Any PMI index level of greater than 50 equates to expansion in that market, any PMI level of 50 equates to no change in that market and any PMI index level of below 50 equates to contraction in that market.
This information helps us better understand the fluctuations in supply and demand, as well as relevant history to predict how pricing will change based on lead times, supply problems and demand trends.